Back to Projects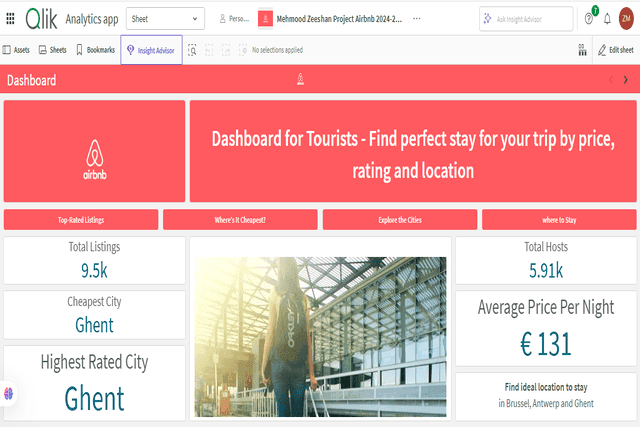
StayScout
Individual ProjectIndividual Project (Data Visualization)
StayScout
Individual Project (Data Visualization)
This project is an interactive dashboard designed for tourists to help them find the best and most budget-friendly Airbnb listings across major Belgian cities — Brussels, Antwerp, and Ghent.
The dashboard includes several key sections:
• A Home Dashboard summarizing total listings, total hosts, cheapest city, highest rated city, and average price per night
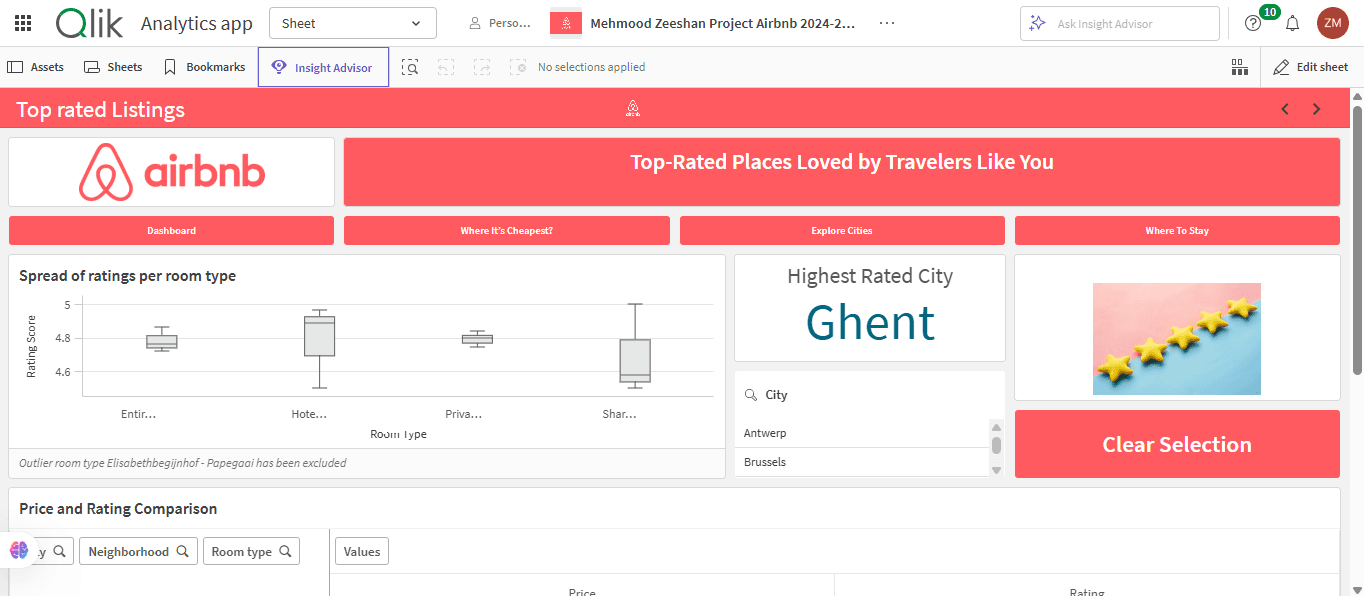
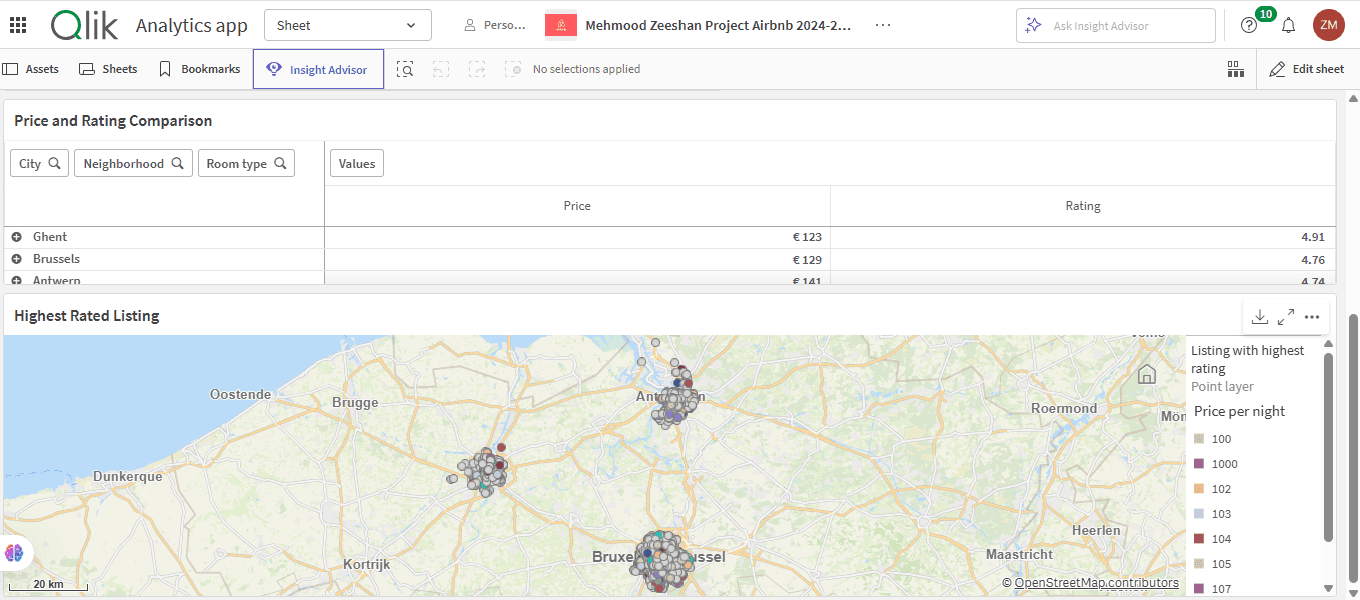
• A Top Rated Listings sheet that maps top-rated listings, compares prices and ratings, and visualizes spread through box plots
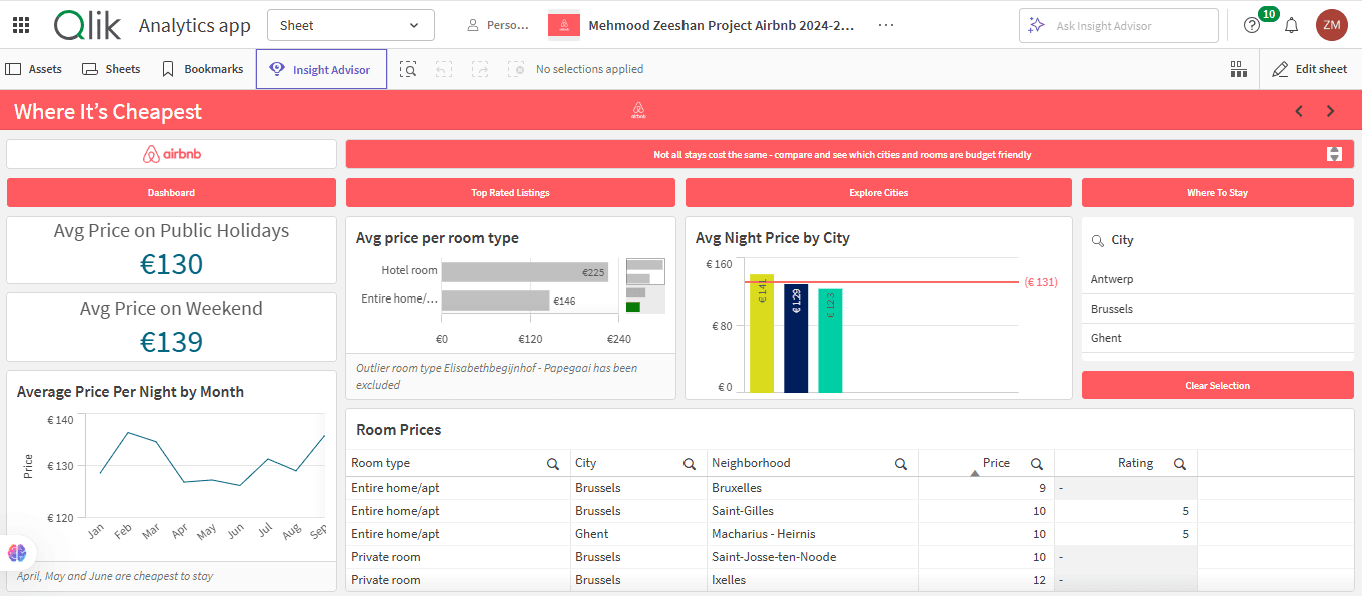
• A Cheapest Options section exploring average prices per room type, city, and time (weekends/public holidays/months), along with a sortable room-price table
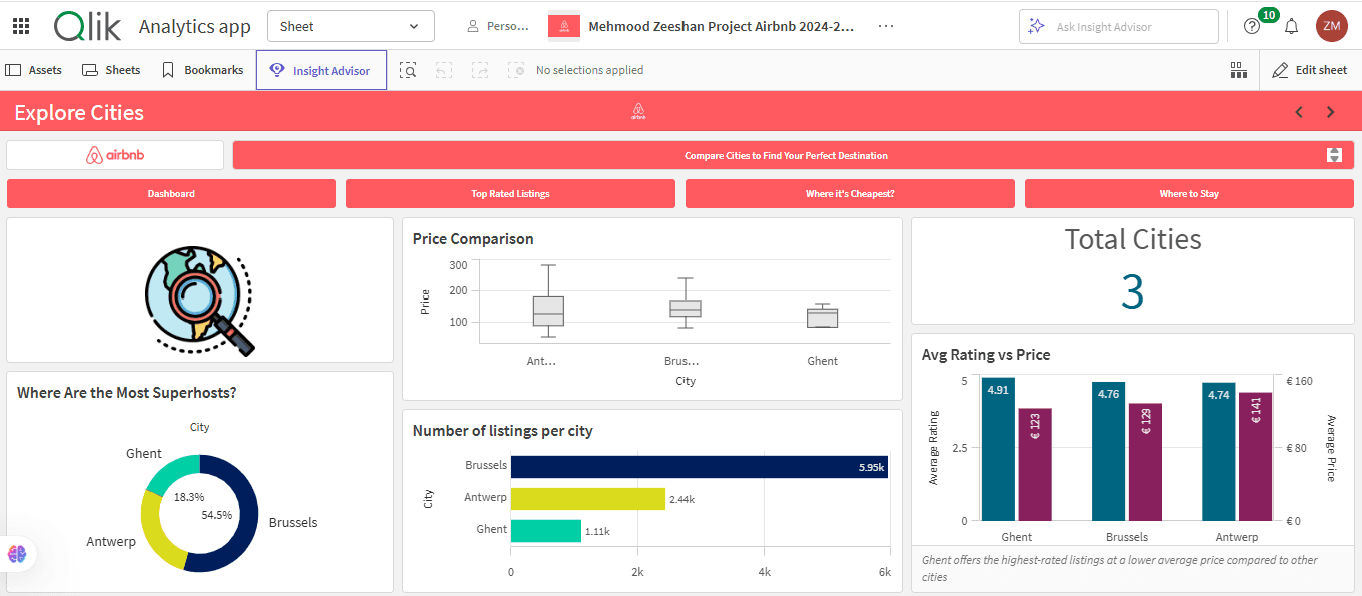
• An Explore Cities sheet for side-by-side city comparisons including price, ratings, superhost presence, and number of listings
• A Where to Stay sheet that identifies high-rated listings under €30 per night, with filtering options
The project was built using Qlik Sense with various set expressions for filtering and aggregating data.
Key Learnings:
- Mastered data visualization techniques using Qlik Sense
- Learned to use set expressions to isolate data and perform complex aggregations
- Developed skills in map visualization and multi-sheet dashboard design
- Understood patterns in seasonal pricing and rating distribution for Airbnb listings
- Practiced user-centric design for travel-based analytics
Screenshots
Technologies Used:
Qlik Sense
My Contribution
I built the entire dashboard independently using Qlik Sense. My contributions include: • Designing the multi-sheet layout and determining relevant KPIs for tourists • Implementing set expressions to isolate selections (e.g., average price on weekends/public holidays) • Creating point layers to filter and highlight listings under €30 with high ratings • Using visualizations like box plots, combo charts, and map layers to provide deep insights • Enabling interactive filters by city, room type, and time periods • Optimizing UX to help tourists make smart booking decisions